Where Can I Find a PS5? - Global PS5 Demand Tracker
When Sony’s PlayStation 5 launched in November 2020, it sold out almost immediately. Lauded by critics and players alike for its revolutionary design, impressive resolution and innovative controller, the PS5 remains difficult to find.
Last July, Sony announced that the PS5 was the fastest-selling PlayStation console ever. It passed ten million global sales in 248 days. As the festive season looms, gamers across the globe seem to be searching harder than ever for the next-gen console.
Last month, the term “PS5” was Googled an estimated 28 million times, often accompanied by keywords such as “where to buy”, “availability” and “restock”. Since releasing the console, Sony has faced a multitude of technical challenges.
From dwindling global chip supplies causing PS5 parts shortages, shipping disruptions and natural disasters, it’s little wonder that demand for PS5 far exceeds supply. Experts predict, in fact, that console shortages will continue throughout the new year.
To learn more about PlayStation 5 demand around the world, we conducted a keyword study. Our study compares keyword search volume from 157 different countries. We also carried out an in-depth analysis of keyword search volume across the UK.
The countries with the highest PS5 demand
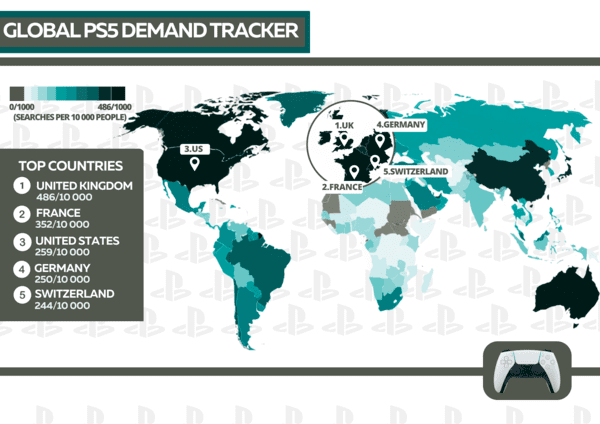
To find out where the PS5 is most in demand, we analysed data from 157 countries. UK residents searched for “PS5” the most, with 486 searches being made per 10, 000 people. By August 2020, one million consoles had been sold in the UK, with the PS5 replacing the PS4 as the nation’s most popular console.
There was also significant keyword search volume from France, the United States, Germany and Switzerland. Ireland and Sweden narrowly missed out on the top five spots, scoring 243/10 000 and 227.7/10 000 respectively.
In some countries, retailers have started to take action against scalpers (buyers who purchase consoles to sell them at a higher price), by destroying controller packaging and writing the buyer’s name on the PlayStation box.
The Top 20 Countries
|
Country |
Impressions |
Rate Per 10 000 People |
|
UK |
3300000 |
486.1089864 |
|
France |
2300000 |
352.3634572 |
|
US |
8600000 |
259.8166502 |
|
Germany |
2100000 |
250.644688 |
|
Switzerland |
212000 |
244.9558167 |
|
Ireland |
120000 |
243.0238978 |
|
Sweden |
230000 |
227.7393454 |
|
Australia |
528000 |
207.0597654 |
|
Netherlands |
331000 |
193.1733135 |
|
Denmark |
111000 |
191.6369629 |
|
Norway |
100000 |
184.4596099 |
|
Canada |
679000 |
179.9049413 |
|
Austria |
161000 |
178.7618091 |
|
Belgium |
206000 |
177.7452122 |
|
Italy |
1000000 |
165.3936155 |
|
New Zealand |
71000 |
147.234694 |
|
Finland |
78000 |
140.775928 |
|
Poland |
520000 |
137.3967143 |
|
Portugal |
136000 |
133.3763668 |
|
Hong Kong |
98000 |
130.7192855 |
UK regional PS5 demand
![]()
We also analysed keyword search volume data from 69 British cities. We learned that residents of Newry, Northern Ireland searched for the term “PS5” the most, with 24.6 searches being made per 1000 people. Truro and Ely featured in the top three, scoring 243/10 000 and 227.7/10 000 respectively The PS5 appears to be the least in demand in Cheshire, with only 0.7 searches being made per 1000 people.
The Top 20 Cities
| City | Impressions |
Rate per 1000 searches
|
| Newry | 664.17 | 24.62899099 |
| Truro | 265.69 | 14.1580518 |
| Ely | 233.69 | 11.61943119 |
| Stirling | 409.93 | 10.89949482 |
| Newcastle upon Tyne | 2,763.29 | 10.30832189 |
| Chichester | 238.22 | 10.03834647 |
| Glasgow | 6,290.11 | 9.935099191 |
| Liverpool | 4,875.61 | 9.814345873 |
| Bristol | 4,558.83 | 9.759879597 |
| Norwich | 1,377.44 | 9.62336256 |
| Peterborough | 1,924.31 | 9.514088372 |
| Salisbury | 424.5 | 9.433333333 |
| Manchester | 5,090.90 | 9.202140159 |
| Birmingham | 10,411.49 | 9.061348999 |
| Lincoln | 877.3 | 8.994166556 |
| Preston | 1,214.94 | 8.566895599 |
| Lichfield | 276.78 | 8.184882896 |
| Derby | 2,073.08 | 8.012027239 |
| Leicester | 2,862.59 | 8.009619635 |
| Edinburgh | 4,091.31 | 7.79401063 |
Methodology
Global keyword search volume
We used “keyword planner” and Ahrefs to determine where demand for the PS5 was highest. We searched for the term “PS5” and noted the number of impressions for each country. We then divided the number of impressions by population and multiplied by 100 to determine the total percentage of population. To determine the search rate per 10 000 people, we divided the total population by 10, 000, and the number of impressions by the result.
Example (UK)
|
Country |
Impressions |
Population |
Sum 1 |
Total percentage of population |
Sum 2 |
Rate per 10, 000 searches |
|
UK |
3300000 |
67,886,011 |
0.04861089864 |
4.861089864 |
6788.6011 |
486.1089864 |
Regional keyword search volume
We used “keyword planner” to determine which UK cities had the highest demand for the PS5. We searched for the term “PS5” and noted the number of impressions for each city (69 in total). We then divided the number of impressions by population, and multiplied by 100 to determine the total percentage of population. To determine the search rate per 10 000 people, we divided the total population by 10, 000, and the number of impressions by the result.
Example (Newry)
|
City |
Impressions |
Population |
Sum 1 |
Total percentage of population |
Sum 2 |
Rate per 10, 000 searches |
|
Newry |
664.17 |
26,967 |
0.02462899099 |
2.462899099 |
26.967 |
24.62899099 |

Leave a comment